WHY INVEST
ONTARIO FARMLAND AS AN ALTERNATIVE ASSET
The world needs food. The world needs Ontario.
We believe demand for agricultural products will continue to grow as populations grow and demand for fresh produce increases. At the same time, the world loses thousands of arable acres each year to urban development, soil degradation and water shortages. Feeding the world will require that the remaining productive farmland continues to increase its productivity.
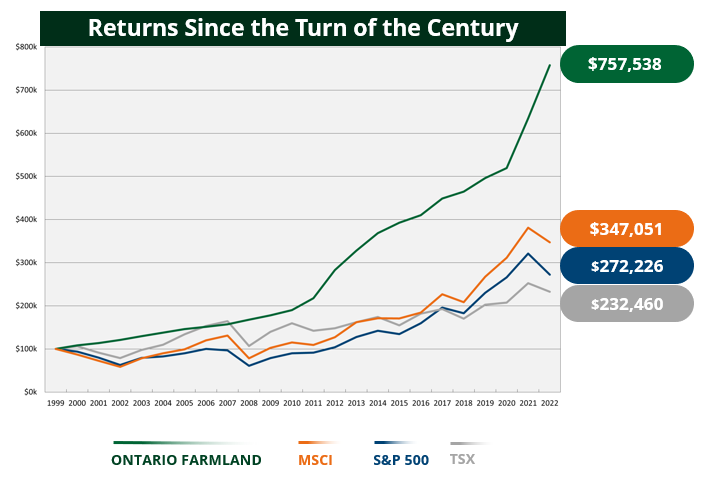
In addition to its strong performance, Ontario farmland has proven to be uncorrelated to other financial assets making it a valuable addition to a well diversified investment portfolio. We believe Ontario farmland is among the best in the world. Ownership is very fragmented and thus offers some unique opportunities for an investor involved in aggregating ownership. The historical performance of Ontario farmland during periods of high inflation makes it an effective asset in protecting generational wealth.

Premium farmland, here in Ontario
AGinvest was created to capitalize on the inherent advantages of Canadian farmland and the growing global demand for food production.
Ontario farmland in particular, is among the very best in the world and represents a market of over 13 million acres with a total capitalization of approximately $150 billion. Farmland turnover in this region is estimated to exceed $5 billion annually.
Our logistics, climate, quality soil, consistent rainfall and access to an abundance of supplementary fresh water, make the region's farmland extremely valuable.
Banking on the best
While Ontario is a large province, we look for very specific regions within the province where most of the premium farmland is located. These regions have unique characteristics that include:
- A long frost-free growing season with ample heat for growing 200 plus staple crops
- Consistent rainfall throughout the growing season (little need for costly irrigation)
- Access to unlimited fresh water supplies through most of the Great Lakes basin
- Deep and rich soils deposited in the region during the last glacial period
- Exceptional logistics and infrastructure that can quickly access ports to the global market
- Highly educated workforce able to plan and manage farm operations efficiently
- Surrounded by major urban markets that require fresh market produce
AGinvest Farmland Properties Canada provides investors access to premium Ontario farmland.
AGinvest Farmland Properties Canada raises capital to purchase, optimize and manage premium Ontario farmland. We work with progressive farm operators using a grower’s agreement to generate annual income.
Growth for Accredited Investors
AGinvest can diversify your investment portfolio with Ontario farmland. Consider the advantages we provide:
- Long-term history of growth
- Uncorrelated with capital market returns
- Macro-economic trends that favour productive farmland
- An opportunity to benefit from potential cost savings and revenue increases that could be available to aggregators of farmland in the region
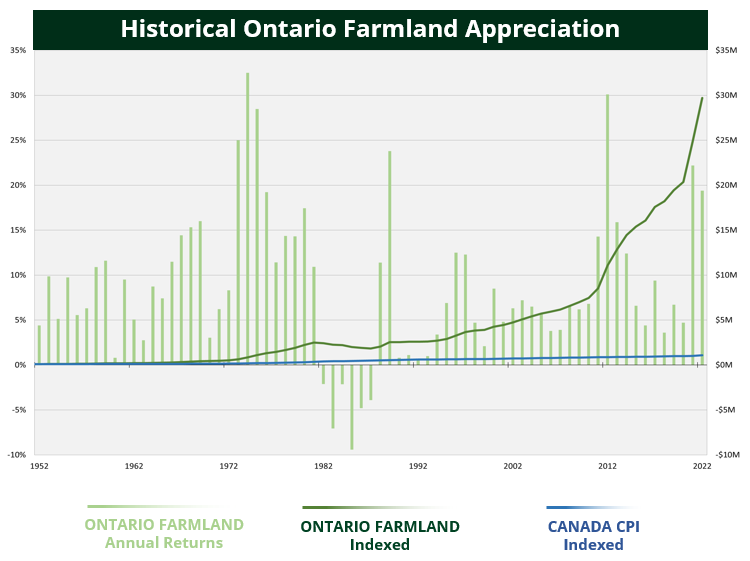
With the exception of only 5 years, farmland values in Ontario have risen steadily in the past 70 years. Ontario farmland is currently poised to capitalize on converging trends that will be vital for the global food production system in the coming future.

For illustrative purposes only. This illustration depicts how Ontario farmland valued at $100,000 in 1951 has grown in value over time compared to the CPI index. The average Ontario farmland appreciation rate, reported by Statistics Canada and FCC starting in 1985, was used for calculation purposes. The average appreciation rate between 1951 and 2022 may not be indicative of what an investor can expect in the future.
Performance

*For AG1, the performance denoted is based on a non-IFRS measure of net assets per share, and independent appraisals are conducted annually and submitted to our auditors who audit the appraisals and calculate the NAV. The NAV does not include deferred tax or performance fees.
**For AG2 and AG3, the performance denoted is based on a non-IFRS measure of net assets per share, and independent appraisals are conducted annually and submitted to our auditors who audit the appraisals and calculate the NAV. The NAV does not include deferred tax.
Interested in learning more about investing?
Click the link below, provide our team with some qualifying information and we will contact you as soon as possible.